
POSTMAN BEST PRACTICES
API Observability
Building quality APIs has never been more important. At Postman, we believe being API-first is the key to innovation in the AI era. We built Postman Best Practices to share the foundational ideas Postman is built on and enable you to do your best work.
Too often, teams learn about API failures from customer reports rather than their own monitoring. When issues do surface, your dashboards show infrastructure metrics like CPU spikes but don't reveal which specific endpoint is failing, what error users are encountering, or the steps to reproduce the problem.
This chapter shows you how to build continuous health monitoring directly into your development workflow. You'll transform your existing tests into automated monitors that catch regressions before production, automatically discover API endpoints from live traffic, and instantly reproduce failing scenarios using real user data.

Abhinav Asthana
Postman CEO and Co-founder

Ankit Sobti
Postman Field CTO and Co-founder
Engineering teams often discover API issues the same way: a customer reports a problem, and the team scrambles through logs to figure out what went wrong. By the time you identify the failing endpoint and reproduce the issue, more users have been affected.
Most engineering teams have monitoring in place, but turning that data into actionable insights can be challenging. You may end up with dashboards that look busy but don’t really point to the root of an issue. A spike in CPU usage might indicate a problem, but it doesn’t tell you which specific endpoint is failing, what type of error users are seeing, or how to reproduce it.
API observability solves this problem by building continuous health monitoring directly into your development workflow. Transform your existing tests and collections into a comprehensive observability system that provides immediate context when issues occur.
Build observability from existing tests
Your API tests already contain valuable observability signals. Every exploratory test, functional validation, integration check, and contract test generates health information about your APIs. The key is systematically capturing and analyzing this data over time to understand system behavior patterns.
Implementation guide
Transform your existing test collections from API Test Automation into continuous observability tools by scheduling them to run at regular intervals and analyzing results as health trends rather than pass/fail indicators.
Each type of test provides distinct observability signals when run continuously:
- Functional/smoke tests can serve as uptime and availability checks.
- Integration tests act as ongoing monitors of service dependency health.
- End-to-end workflow tests measure the reliability of real user journeys.
- Contract tests surface issues with API compatibility and highlight breaking changes.
- Performance tests track latency and throughput trends over time.
This data becomes most valuable when viewed as patterns over time. A single failed test might be environmental noise, but a trending decrease in the success rates of contract tests indicates evolving compatibility issues.
Recommended practices
- Add health-focused assertions alongside your existing test validation logic to capture observability signals.
- Use environment variables to run the same observability collections across development, staging, and production with context-appropriate thresholds.
- Configure trend-based alerting that notifies you when success rates decline over time, even when individual tests still pass.
- Schedule monitoring frequency based on API criticality: critical user-facing APIs every 5-15 minutes, internal services hourly, and contract validation around deployment cycles.
- Export test results to external monitoring systems for comprehensive dashboard integration and long-term analysis.
Continuously monitor the APIs themselves
Most API failures don’t start with a major outage; they creep in as small regressions that escape notice until users are affected. Traditional system monitoring can flag symptoms like CPU spikes, but it doesn’t tell you if your APIs themselves are still behaving correctly. This is where Postman Monitors come in.
Monitors transform your Postman Collections into automated checks that run on a schedule or on demand. They validate the health of your APIs directly, so teams can catch problems earlier, before customers do.
- Scheduled monitors act as ongoing health checks. They continuously validate uptime, integration dependencies, and end-to-end workflows at defined intervals. By running the same tests across dev, staging, and production, you can see health trends instead of isolated pass/fail signals.
- On-demand monitors extend this safety net to deployment time. Instead of waiting for the next scheduled run, teams can trigger monitors directly in their CI/CD pipelines. This ensures that every release is validated in real-time, turning monitors into release gates that prevent regressions from reaching production.
When you use both types of monitors, developers know right away if their code is safe to deploy, which helps Ops and QA teams reduce firefighting in production. Leaders can also prevent costly rollbacks and compliance risks with consistent, reliable coverage.
Together, scheduled and on-demand monitors provide full lifecycle coverage: Scheduled monitors ensure continuous reliability, while on-demand monitors give you confidence in deployment time.
Advanced analytics with Postman Insights
Postman Insights helps developer productivity by focusing on what matters most: actual API calls made by real users. Instead of monitoring infrastructure metrics, Insights directly observes API traffic to provide immediate visibility into problems that affect users. This improves the mean time to resolution for incidents caused by API errors, including client/server error codes (4xx/5xx) and performance degradation due to latency.
API observability patterns in Postman Insights
The most powerful aspect of API observability in Postman is Postman Insights Repro Mode, which automatically captures failing API calls and converts them into executable Postman requests. When an error occurs, teams can instantly replay the exact conditions that caused the failure. In the request builder, teams can save these requests as collections and use them in any collaboration workflow.
This eliminates the time-consuming process of manually recreating error scenarios from log files, providing immediate debugging context.
Different teams use observability in distinct ways depending on their operational needs and service architecture.
Development team monitoring: real-time issue detection
In this pattern, development teams deploy Insights on services they own to get immediate visibility into API health. Teams respond to alerts during business hours and use observability data to inform development priorities.
Implementation guide
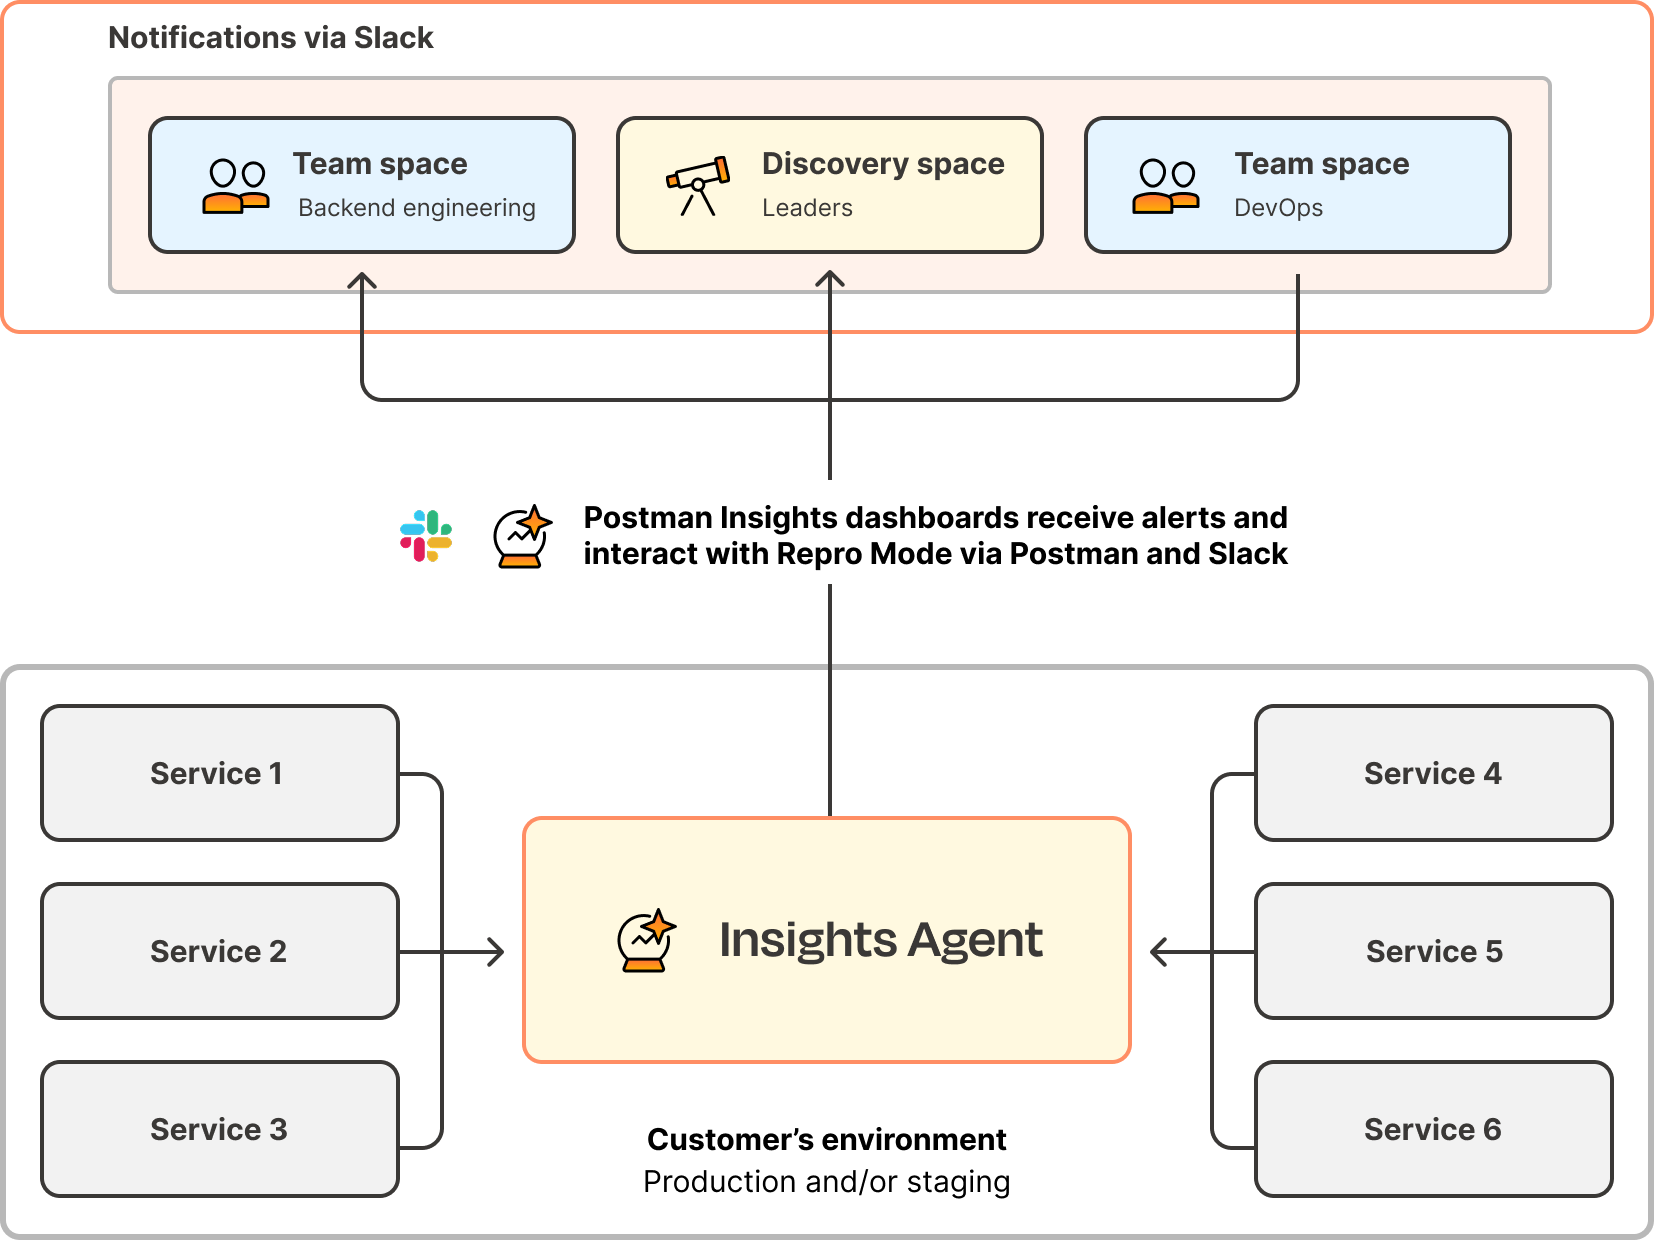
Deploy the Insights Agent as a sidecar container in your environment using the provided Kubernetes, ECS, EC2, or Elastic Beanstalk configurations. Configure alerts to notify your team's Slack channel when error rates exceed normal thresholds.
Recommended practices- Set up one Insights project per service in your team's workspace
- Configure 5xx error alerts to fire immediately when server errors occur
- Enable Repro Mode from the project settings to capture failing requests automatically
- Use the Save to Collections feature to export failing scenarios for regression testing
- Review weekly error summaries during team retrospectives to identify patterns
- Microservices teams monitoring individual service health
- API teams supporting mobile applications with critical uptime requirements
- Platform teams providing shared services to multiple internal consumers
Operations team monitoring: cross-service visibility
Deploy Insights across multiple services to gain system-wide visibility of API health. This pattern focuses on understanding dependencies between services and coordinating incident response across teams.
Implementation guide
Deploy Insights Agent across all critical services using infrastructure automation. Configure alert routing to ensure the right teams get notified about issues in their services while giving operations teams visibility into system-wide patterns.
Recommended practices
- Deploy monitoring on all production services, starting with user-facing APIs.
- Establish escalation policies that route alerts to the relevant service owners.
- Use cross-service error correlation to identify cascade failures.
- Maintain runbooks that include Insights links for common incident types.
- Export discovered endpoints to maintain an accurate service catalog.
- Platform reliability teams managing microservices architectures
- DevOps teams supporting continuous deployment pipelines
- Site reliability teams responsible for overall system health
Product team monitoring: user experience validation
Product teams use Insights to understand how API performance affects user experience. This pattern focuses on correlating API errors with user journey completion rates and feature adoption.
Implementation guide
Deploy Insights on APIs that directly support user-facing features. Configure alerts for user-impacting errors and integrate observability data with product analytics to understand the relationship between API health and user experience.
Recommended practices
- Monitor APIs that support critical user journeys, such as signup, checkout, and data access.
- Set up alerts for authentication failures that might indicate onboarding issues.
- Track error patterns across different user segments or geographic regions.
- Use performance data to inform feature prioritization and technical debt decisions.
- Share API health metrics with product stakeholders through regular reports.
Common use cases
- Product teams launching new features that depend on API integrations
- Customer success teams identifying technical issues affecting user retention
- Growth teams optimizing conversion funnels that involve multiple API calls
Managing failures in production
When Insights detects a failing API call, here's how teams typically resolve it:
- Click the failing endpoint in Insights to see error details and frequency
- Use Repro Mode to automatically populate a Postman request with the exact failing parameters
- Test the fix by modifying the request and validating the response
- Save the scenario to a collection to prevent regression after deployment
- Share the failing request with team members via workspace links for collaborative debugging
Building test coverage from real usage
Use Insights data to improve your testing strategies:
- Discover missing test cases: Go to the Endpoints tab in Insights and filter by endpoints that aren't covered in your existing collections. Export these to collections to fill testing gaps.
- Create regression tests: When you fix a production issue through Repro Mode, save the failing scenario as a test case. This ensures the same issue doesn't recur in future releases.
- Validate fixes in production: After deploying fixes, monitor the same endpoint in Insights to confirm error rates decrease and stay low.
Managing undocumented APIs
Insights automatically discovers all API endpoints receiving traffic, including ones that may not be officially documented:
- Audit your API surface: Review the complete list of discovered endpoints to identify APIs that should be documented or deprecated.
- Export for documentation: Use Save to Collections to create Collections from discovered endpoints, then enhance them with proper documentation.
- Set up monitoring: Add monitors for critical undocumented endpoints to ensure they remain stable while you decide their long-term status.
Monitors and Insights together give you a complete observability picture:
- Monitors validate what should happen (tests you design, scheduled or at deploy).
- Insights shows what is actually happening (real user traffic, errors, latency, repro scenarios).
This combination enables you to both prevent regressions and resolve live issues more quickly. With Monitors ensuring proactive coverage and Insights providing real-user context, teams close the loop on observability.
Ready to get hands-on? Get started with Postman Insights →